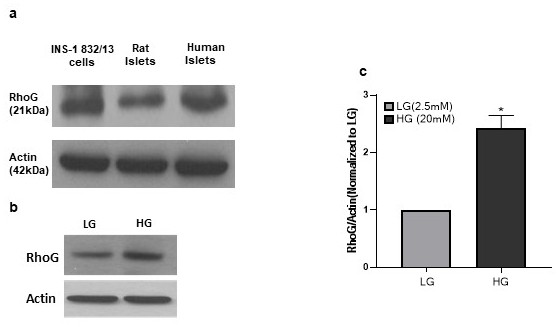
Fig. 1. Panel a: Expression of RhoG in INS-1 832/13 cells, rat islets and human islets. Lysates from INS-1 832/13 cells, rat and human islets were analyzed for RhoG protein expression by Western blot analysis. Actin was used as loading control. Panel b: Expression of RhoG is increased in INS-1 832/13 cells following chronic exposure to high glucose conditions. INS-1 832/13 cells were incubated with basal glucose (2.5 mM) or high glucose (20 mM) for 24 hours and lysates were analyzed by western blotting for the expression of RhoG. Actin was used as loading control. Panel c: Densitometric quantitation of RhoG band intensities depicted in Panel b is shown here. The results are presented as means ±SEM. The data are expressed as fold change relative to LG (n=3;*p< 0.05).